Latest News
Gambling.com Group Limited Reports Third Quarter 2021 Financial Results

Gambling.com Group Limited, a leading provider of digital marketing services active exclusively in the global online gambling industry, today announced its operating and financial results for the third quarter ended September 30, 2021.
Third Quarter 2021 Financial Highlights
- Revenue of $10.1 million grew 37% compared to $7.4 million in the same period for the prior year
- Net income of $4.7 million, or $0.13 per diluted share, compared to a net income of $2.3 million, or $0.08 per diluted share, in the same period for the prior year
- Adjusted EBITDA of $3.5 million decreased 14% compared to $4.0 million in the same period for the prior year, representing an Adjusted EBITDA margin of 34%1
- Free cash flow of $0.8 million decreased 81% compared to $3.9 million in the same period for the prior year2
Third Quarter 2021 Business Highlights
- Completed successful public listing of common shares on the Nasdaq Global Market under the ticker symbol “GAMB”
- Announced appointment of Mr. Daniel D’Arrigo to Board of Directors
- Received temporary supplier license from the Arizona Department of Gaming to provide marketing services to licensed operators in the state and launched free-to-use comparison of legal online sports betting services on BetArizona.com
- Launches of Marylandbets.com, casinosource.nl and gambling.com/nl providing bettors in Maryland and the Netherlands with trusted and up to date gambling information to help them place safe and secure legal wagers
- Completed acquisition of domains suitable for targeting the US market
“Our financial performance in the third quarter remained strong as we grew revenue by 37% compared to the prior year and, despite the third quarter being the seasonally slowest quarter of the year, delivered an Adjusted EBITDA margin of 34%,” said Charles Gillespie, Chief Executive Officer and co-founder of Gambling.com Group. “Importantly, after the quiet summer months of July and August, we delivered all-time-high revenue in September. With the launch of Arizona and the kickoff of the NFL season, we saw a significant uplift in U.S. revenue in September and our U.S. performance exceeded our internal expectations. Entering the quarter with good momentum we are encouraged by the start to our seasonally stronger fourth quarter. We remain highly focused on prudently growing the Company through both sustained organic growth and future accretive acquisitions which we continue to actively pursue”
1 Adjusted figures represent non-IFRS information. See “Non-IFRS Financial Measures” and the tables at the end of this release for an explanation of the adjustments and reconciliations to the comparable IFRS numbers.
2 Adjusted figures represent non-IFRS information. See “Non-IFRS Financial Measures” and the tables at the end of this
release for an explanation of the adjustments and reconciliations to the comparable IFRS numbers.
Third Quarter 2021 vs. Third Quarter 2020 Financial Highlights
|
|
|
THREE MONTHS ENDED |
|
|
CHANGE |
|
||||||||||
|
|
|
2021 |
|
|
2020 |
|
|
$ |
|
|
% |
|
||||
|
|
|
(in thousands USD, except for |
|
|
|
|
|
|
|
|||||||
|
CONSOLIDATED STATEMENTS OF |
|
|||||||||||||||
|
Revenue |
|
$ |
10,123 |
|
|
$ |
7,406 |
|
|
$ |
2,717 |
|
|
|
37 |
% |
|
Operating expenses |
|
|
(7,722 |
) |
|
$ |
(3,931 |
) |
|
$ |
(3,791 |
) |
|
|
96 |
% |
|
Operating profit |
|
|
2,401 |
|
|
|
3,475 |
|
|
|
(1,074 |
) |
|
|
(31 |
)% |
|
Income before tax |
|
|
2,694 |
|
|
|
2,609 |
|
|
|
85 |
|
|
|
3 |
% |
|
Net income for the period attributable to the |
|
$ |
4,675 |
|
|
$ |
2,303 |
|
|
$ |
2,372 |
|
|
|
103 |
% |
|
Net income per share attributable to ordinary |
|
|
0.14 |
|
|
|
0.08 |
|
|
|
0.06 |
|
|
|
75 |
% |
|
Net income per share attributable to ordinary |
|
|
0.13 |
|
|
|
0.08 |
|
|
|
0.05 |
|
|
|
63 |
% |
n/m = not meaningful
|
|
|
THREE MONTHS ENDED |
|
|
CHANGE |
|
||||||||||
|
|
|
2021 |
|
|
2020 |
|
|
$ |
|
|
% |
|
||||
|
|
|
(in thousands USD, unaudited) |
|
|
|
|
|
|
|
|||||||
|
NON-IFRS FINANCIAL MEASURES |
|
|
|
|
|
|
|
|
|
|
|
|
||||
|
Adjusted EBITDA |
|
$ |
3,464 |
|
|
$ |
4,027 |
|
|
$ |
(563 |
) |
|
|
(14 |
)% |
|
Adjusted EBITDA Margin |
|
|
34 |
% |
|
|
54 |
% |
|
n/m |
|
|
n/m |
|
||
|
Free Cash Flow |
|
|
754 |
|
|
|
3,917 |
|
|
|
(3,163 |
) |
|
|
(81 |
)% |
n/m = not meaningful
|
|
|
THREE MONTHS ENDED |
|
|
CHANGE |
|
||||||||||
|
|
|
2021 |
|
|
2020 |
|
|
Amount |
|
|
% |
|
||||
|
|
|
(in thousands, unaudited) |
|
|
|
|
|
|
|
|||||||
|
OTHER SUPPLEMENTAL DATA |
|
|
|
|
|
|
|
|
|
|
|
|
||||
|
New Depositing Customers (1) |
|
|
27 |
|
|
|
28 |
|
|
|
(1 |
) |
|
|
(4 |
)% |
(1) We define New Depositing Customers, or NDCs, as unique referral of a player from our system to one of our customers that satisfied an agreed metric (typically making a deposit above a minimum threshold) with the customer, thereby triggering the right to a commission for us.
|
|
|
AS OF |
|
AS OF |
|
CHANGE |
||
|
|
|
2021 |
|
2020 |
|
$ |
|
% |
|
|
|
(Unaudited) |
|
|
|
|
|
|
|
|
|
(in thousands, USD) |
|
|
|
|
||
|
CONSOLIDATED STATEMENTS OF FINANCIAL |
|
|
|
|
|
|
|
|
|
Cash and cash equivalents |
|
$53,160 |
|
$8,225 |
|
$44,935 |
|
n/m |
|
Working capital (2) |
|
55,064 |
|
10,059 |
|
45,005 |
|
n/m |
|
Total assets |
|
91,648 |
|
45,383 |
|
46,265 |
|
n/m |
|
Total borrowings |
|
5,919 |
|
5,960 |
|
(41) |
|
n/m |
|
Total liabilities |
|
11,373 |
|
11,171 |
|
202 |
|
n/m |
|
Total equity |
|
80,275 |
|
34,212 |
|
46,063 |
|
n/m |
(2) Working capital is defined as total current assets minus total current liabilities.
n/m = not meaningful
Revenue
Total revenue in the third quarter increased 37% to $10.1 million compared to $7.4 million in the comparable period for the prior year. On a constant currency basis, revenue increased $2.3 million, or 30%. The increase was driven by improved monetization of NDCs that we attribute to a combination of technology improvements and changes in product and market mix. NDCs decreased 4% to 27,000 compared to 28,000 in the prior year.
Our revenue disaggregated by market is as follows:
|
|
|
THREE MONTHS ENDED |
|
|
CHANGE |
|
||||||||||
|
|
|
2021 |
|
|
2020 |
|
|
$ |
|
|
% |
|
||||
|
|
|
(in thousands USD, unaudited) |
|
|
|
|
|
|
|
|||||||
|
U.K. and Ireland |
|
$ |
4,483 |
|
|
$ |
4,311 |
|
|
$ |
172 |
|
|
|
4 |
% |
|
Other Europe |
|
|
2,718 |
|
|
|
1,162 |
|
|
|
1,556 |
|
|
|
134 |
% |
|
North America |
|
|
2,270 |
|
|
|
1,081 |
|
|
|
1,189 |
|
|
|
110 |
% |
|
Rest of the world |
|
|
652 |
|
|
|
852 |
|
|
|
(200 |
) |
|
|
(23 |
)% |
|
Total revenues |
|
$ |
10,123 |
|
|
$ |
7,406 |
|
|
$ |
2,717 |
|
|
|
37 |
% |
Revenue increases were primarily driven by organic growth in our Other Europe and North American markets.
Our revenue disaggregated by monetization is as follows:
|
|
|
THREE MONTHS ENDED |
|
|
CHANGE |
|
||||||||||
|
|
|
2021 |
|
|
2020 |
|
|
$ |
|
|
% |
|
||||
|
|
|
(in thousands USD, unaudited) |
|
|
|
|
|
|
|
|||||||
|
Hybrid commission |
|
$ |
2,808 |
|
|
$ |
3,847 |
|
|
$ |
(1,039 |
) |
|
|
(27 |
)% |
|
Revenue share commission |
|
|
829 |
|
|
|
794 |
|
|
|
35 |
|
|
|
4 |
% |
|
CPA commission |
|
|
5,455 |
|
|
|
2,535 |
|
|
|
2,920 |
|
|
|
115 |
% |
|
Other revenue |
|
|
1,031 |
|
|
|
230 |
|
|
|
801 |
|
|
|
348 |
% |
|
Total revenues |
|
$ |
10,123 |
|
|
$ |
7,406 |
|
|
$ |
2,717 |
|
|
|
37 |
% |
Revenue increases were driven primarily by additional CPA commission and Other revenue. The increase in Other revenue was driven primarily by bonuses related to achieving certain operator NDC performance targets.
Our revenue disaggregated by product type from which it is derived is as follows:
|
|
|
THREE MONTHS ENDED |
|
|
CHANGE |
|
||||||||||
|
|
|
2021 |
|
|
2020 |
|
|
$ |
|
|
% |
|
||||
|
|
|
(in thousands USD, unaudited) |
|
|
|
|
|
|
|
|||||||
|
Casino |
|
$ |
7,965 |
|
|
$ |
6,354 |
|
|
$ |
1,611 |
|
|
|
25 |
% |
|
Sports |
|
|
2,076 |
|
|
|
858 |
|
|
|
1,218 |
|
|
|
142 |
% |
|
Other |
|
|
82 |
|
|
|
194 |
|
|
|
(112 |
) |
|
|
(58 |
)% |
|
Total revenues |
|
$ |
10,123 |
|
|
$ |
7,406 |
|
|
$ |
2,717 |
|
|
|
37 |
% |
Revenue increases were driven by growth in revenue from casino and sports products.
Operating Expenses
|
|
|
THREE MONTHS ENDED |
|
|
CHANGE |
|
||||||||||
|
|
|
2021 |
|
|
2020 |
|
|
$ |
|
|
% |
|
||||
|
|
|
(in thousands USD, unaudited) |
|
|
|
|
|
|
|
|||||||
|
Sales and marketing expenses |
|
$ |
3,587 |
|
|
$ |
1,790 |
|
|
$ |
1,797 |
|
|
|
100 |
% |
|
Technology expenses |
|
|
1,123 |
|
|
|
663 |
|
|
|
460 |
|
|
|
69 |
% |
|
General and administrative expenses |
|
|
2,978 |
|
|
|
1,402 |
|
|
|
1,576 |
|
|
|
112 |
% |
|
Allowance for credit losses and write offs |
|
|
34 |
|
|
|
76 |
|
|
|
(42 |
) |
|
|
(55 |
)% |
|
Total operating expenses |
|
$ |
7,722 |
|
|
$ |
3,931 |
|
|
$ |
3,791 |
|
|
|
96 |
% |
n/m = not meaningful
Total operating expenses increased by $3.8 million to $7.7 million compared to $3.9 million in the prior year. On a constant currency basis, operating expenses increased by $3.5 million to $7.7 million compared to $4.2 million in the prior year. The increase was driven primarily by headcount across Sales and Marketing, Technology, and General and Administrative functions as we invest in the Company’s organic growth initiatives as well as increased administrative expenses associated with operating as a public company.
Sales and Marketing expenses totaled $3.6 million compared to $1.8 million in the prior year. The increase was driven primarily by increased wages and salary expenses associated with increased headcount and professional services.
Technology expenses totaled $1.1 million compared to $0.7 million in the prior year. The increase was driven primarily by increased wages and salary expenses associated with increased headcount partially offset by capitalized development costs.
General and Administrative expenses totaled $3.0 million compared to $1.4 million in the prior year. The increase was driven primarily by increased wages and salary expenses associated with increased headcount, professional services, and insurance expenses.
Earnings
Adjusted EBITDA decreased by 14% to $3.5 million compared to $4.0 million in the prior year representing an Adjusted EBITDA margin of 34%. The decrease was driven primarily by increased operating expenses partly offset by increased revenue.
Operating profit in the third quarter decreased 31% to $2.4 million compared to $3.5 million in 2020. The decrease was driven primarily by a decrease in Adjusted EBITDA and an increase in share-based payments expense.
Net income in the third quarter totaled $4.7 million, or $0.13 per diluted share, compared to net income of $2.3 million, or $0.08 per diluted share, in the prior year. The increase was primarily driven by the recognition of deferred tax assets related to the transferred intangible assets.
Free Cash-flow
Total cash generated from operations of $1.4 million decreased 65% compared to $4.0 million in the prior year. The decrease was driven primarily by decreased adjusted EBITDA, the settlement of non-recurring IPO-related expenses and income tax payments. Free cash flow totaled $0.8 million compared to $3.9 million in the prior year. The decline was the result of decreased cash flow generated from operations and increased capital expenditures consisting primarily of the acquisition of domain names and capitalized development costs.
Balance Sheet
Cash balances as of September 30, 2021 totaled $53.2 million, an increase of $45.0 million compared to $8.2 million as of December 31, 2020. Working capital as of September 30, 2021 totaled $55.1 million, an increase of $45.0 million compared to $10.1 million as of December 31, 2020.
Total assets as of September 30, 2021 were $91.6 million compared to $45.4 million as of December 30, 2020. Total borrowings, including accrued interest, totaled $5.9 million compared to $6.0 million as of December 31, 2020. Total liabilities were $11.4 million compared to $11.2 million as of December 31, 2020.
Total equity as of September 30, 2021 was $80.3 million compared to $34.2 million as of December 31, 2020.
The increases in working capital, total assets, and total equity were driven primarily by the net proceeds received from the IPO and operating profit and net income generated by the Company.
2021 – 2023 Financial Targets
|
|
|
|
|
Total Revenue Growth |
|
> Average 40% |
|
Adjusted EBITDA Margin3 |
|
> Average 40% |
|
Leverage4 |
|
< Net Debt to Adjusted EBITDA 2.5x5 |
2021 Outlook
Elias Mark, Chief Financial Officer of Gambling.com Group, added, “Our third quarter results came in a bit above our expectations and after slow summer trading our financial performance accelerated in September to close out the quarter with the best month in the Company’s history. Our Adjusted EBITDA margin of 34% in the quarter was healthy despite a seasonally slow quarter and investments in scaling the organization for organic growth initiatives and operating as a public company. This is consistent with our prior guidance that our near-term margins may deviate from our average 40% target as we invest in our organic growth plan and pursue our M&A strategy. For the full year, we are reiterating our expectation to achieve both above 40% year-on-year organic revenue growth and approximately 40% Adjusted EBITDA margin. We remain in a very strong financial position after the IPO last quarter which offers us significant optionality going forward to execute our growth plan and each of our capital allocation priorities.”
Conference Call Details
|
|
|
|
|
Date/Time: |
|
Thursday, November 18, 2021, at 9:00 am EST |
|
Webcast: |
|
https://www.webcast-eqs.com/gamb20211118/en |
|
U.S. Toll-Free Dial In: |
|
877-407-0890 |
|
International Dial In: |
|
+1-201-389-0918 |
To access the call, please dial in approximately ten minutes before the start of the call. An accompanying slide presentation will be available in PDF format within the “News & Events” section of the Company’s website.
Latest News
GR8 Tech Brings “Best Workplace 2024” and Fresh LatAm Insights from BIS SiGMA Americas
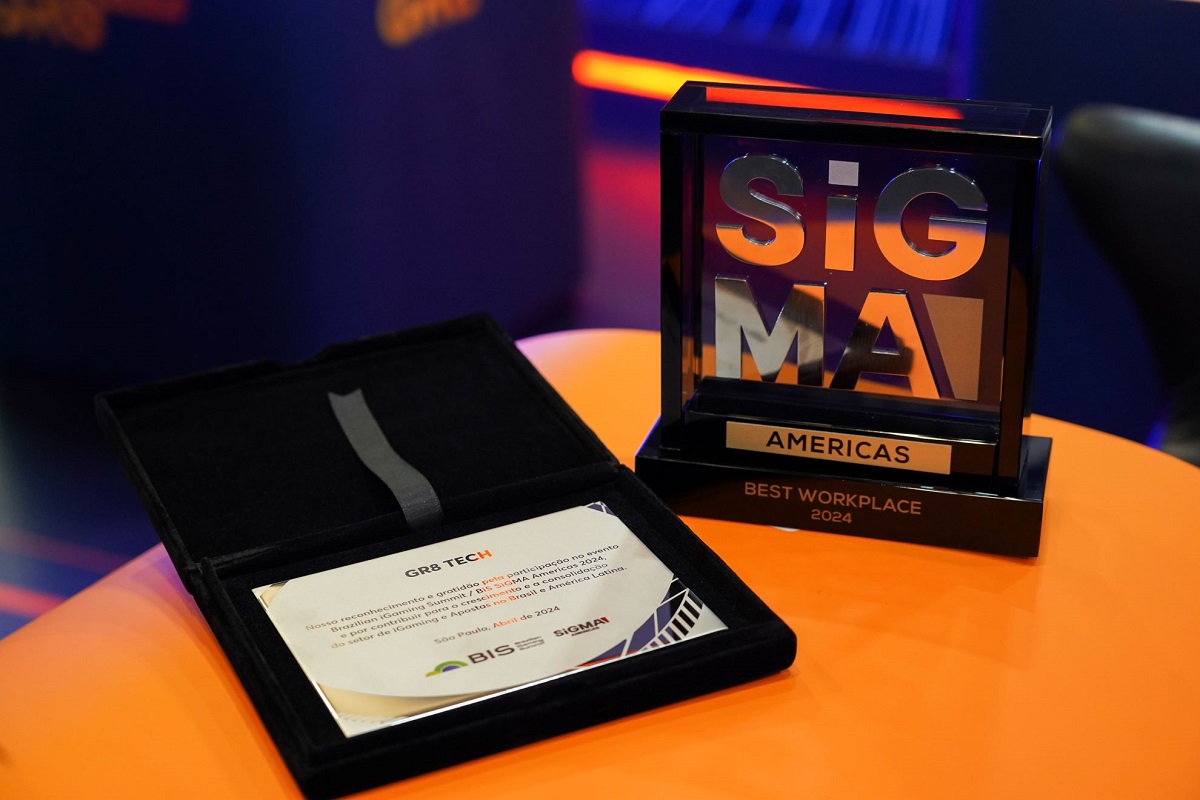
GR8 Tech’s participation at the recent BIS SiGMA Americas event held in São Paulo was quite successful, highlighted by winning the ‘BEST WORKPLACE 2024’ award at the SiGMA Americas Awards and holding over 150 meetings with operators and other stakeholders. These interactions have laid a solid foundation for GR8 Tech’s strategic expansion in the region and provided the team with significant insights into the evolving Latin American iGaming market.
A Closer Look at the Brazilian Market and Wider LatAm
“Brazil is not synonymous with Latin America. Each country on the continent has its own unique characteristics,” Evgen Belousov, GR8 Tech CEO.
The most important thing to understand in the LatAm region is that it’s very diverse. There are significant cultural and operational differences that necessitate a localized approach. For example, “Brazil’s rhythm is distinct; life starts in the afternoon, and business interactions reflect this laid-back pace. To thrive here, understanding and integrating into the local lifestyle is essential.”
Belousov further discussed the Brazilian market’s competitive nature, highlighting retention strategies’ crucial role. “The churn rate is high as players frequently shift between operators lured by aggressive marketing. Hence, having robust retention mechanisms, such as real-time tools and enticing bonus mechanics, is crucial to maintaining a loyal customer base,” he added.
Yevhen Krazhan, CBDO, addressed trending compliance and market preferences. “Regulation is a hot topic, with a keen focus on product compliance. Moreover, while classic sportsbooks saturate the market, emerging interests lie in areas like fantasy sports and social gaming, which present new opportunities for differentiation and growth.”
Thomas Carvalhaes, Senior Business Development Manager for the Latin America region, provided his expertise during the panel discussion “Understanding the demands and evolution of the B2B market”, highlighting the demand for localization and intuitive technology. “In Latin America, where many markets are still learning the ropes of iGaming, the simplicity of the technology is key. Products need to be user-friendly to ensure they meet the expectations of a clientele that values straightforward and engaging gaming experiences,” Carvalhaes explained.
Future Directions and Engagements
Building on the insights and achievements from BIS SiGMA Americas, GR8 Tech is actively expanding its presence in Brazil and LatAm, establishing its reputation as a key player in the region. The company is also exploring opportunities in other global markets, with Asia as the next target at SiGMA Asia, scheduled for June 3-6 in Manila, Philippines. This upcoming event presents another fantastic opportunity for GR8 Tech to demonstrate the capabilities of its flagship GR8 Sportsbook platform and forge new partnerships in another exciting and diverse region. We invite all our partners and clients to stay tuned, following our updates at https://gr8.tech/.
Industry News
The International Association of Gaming Advisors (IAGA) Announces 2024 International Gaming Summit in Washington, D.C.

The International Association of Gaming Advisors (IAGA) will hold its 41st International Gaming Summit Monday, May 27 through Thursday, May 30, 2024 at The Ritz-Carlton Washington, D.C.
As a premier event that brings together leaders from all global gaming sectors, the Summit will provide operators, suppliers, attorneys, investors, bankers, regulators and other advisor delegates with an unparalleled opportunity to meet and discuss the most important issues facing gaming.
“We are looking forward to holding this year’s 41st Annual International Gaming Summit in Washington, D.C., and are pleased to announce an agenda that includes a specific focus on some of the key sports betting issues the rapidly expanding US market is facing. As part of this focus, we will bring together representatives from global sports betting operators, regulatory agencies, professional sports leagues and other experts to discuss how the industry’s sports betting stakeholders can better work together to ensure a sustainable, responsible sports betting environment that is built on best practices lessons learned from other markets,” John Stawyskyj, President of IAGA, said.
“Beyond our sports betting focus, our diverse agenda includes discussions on other issues of importance including the growing impact of fraud and cyber breaches on regulated operators, a look into the federal and state lobbying process, an update on what’s happening in other gaming markets outside North America, a deep dive into new technologies and how they might impact gaming and more. I look forward to welcoming our delegates to Washington and participating with them in lively discussions about these critical issues and more,” Stawyskyj added.
Industry News
Marker Trax Appoints John Henderson as Senior Vice President of Operations

Marker Trax, a leader in cashless payment solutions for the gambling industry, has announced the appointment of John Henderson as its senior vice president of operations.
As the company continues solidifying its cashless payments sector leadership position, Henderson joins the team to play a key role in leading strategic planning efforts, executing new operator and customer initiatives, directing pursuit of key performance indicators, and ensuring overall product and technology quality control. He reports directly to, and will work closely with, Marker Trax President Charlie Skinner.
Henderson is a seasoned, energetic industry veteran who brings to Marker Trax more than four decades of success in delivering technology-based business solutions, leading innovation-forward companies seeking to increase their industry footprints and to solidify their market shares.
“We’re cementing our leadership position in the cashless space, and John is the right leader, at the right time, to help guide us there. He has tactical expertise, and a long track record of success in the IT space. More than that, though, he’s always eager to innovate – which aligns perfectly with our philosophy and goals. We’re lucky to have him on board,” Charlie Skinner, President of Marker Trax, said.
Immediately prior to joining Marker Trax, Henderson served as chief information officer at WorldStrides, a global leader in educational travel services, and helped the company navigate a business and IT transformation program. Henderson has also held client partner roles at Accenture, IBM, and Cognizant, and has served numerous global brands including Choice Hotels, Hilton Hotels, MGM Resorts, Wynn, Disney, and Royal Caribbean.
“Every step of his career, John’s shown natural aptitude for client relationship management and large-scale systems integrations, and a keen, tactical eye for optimizing performance at all levels of an operation. At Marker Trax, we’re increasing our market footprint through continual innovation, and John’s tactical leadership will be of tremendous benefit to reaching our goals,” Skinner said.
Henderson’s addition caps a prolific run of recent accomplishments for the company. It recently unveiled its innovative consumer product, Moolah Play, secured renewed commitment from partner and global payments leader Euronet Worldwide Inc., and is introducing its cashless credit technology into more markets around the country.
-

 Latest News3 days ago
Xpoint Launches Groundbreaking New Capability to Reduce Geolocation Costs for Operators
-

 Latest News4 days ago
FBMDS, Planet Invest and EverPlay Score a Fantastic Goal in a Revolutionary Partnership Involving Ronaldinho Gaucho
-

 Latest News7 days ago
Plaza Hotel & Casino to celebrate summer with Friday night fireworks
-

 Press Releases2 days ago
YouGov unveils US bettor research report, which highlights that 43% of sports bettors use three or more sportsbook apps
-

 Compliance Updates4 days ago
Hub88 granted supplier licence in Peru
-
 eSports7 days ago
HAWKS TALON GC SET FOR THE STEAL ON APRIL 19TH FOR CHANCE TO ENTER NBA 2K LEAGUE 3V3 PLAYOFF
-

 Gambling in the USA4 days ago
Games Global Launches Custom Slot Game Caesars Palace Frenzy with Caesars Digital
-

 Latest News2 days ago
SCCG Announces Strategic Partnership with Comm100 to Enhance Player Engagement with Leading Customer Support Solutions


