Gambling in the USA
Red Rock Resorts Announces Fourth Quarter and Year End 2018 Results
Red Rock Resorts, Inc. reported financial results for the fourth quarter and year ended December 31, 2018. The Company adopted FASB’s new revenue recognition standard (“ASC 606”), effective January 1, 2018. Certain prior period amounts have been adjusted to reflect the full retrospective adoption of ASC 606, with no material impact on operating income, net income or Adjusted EBITDA(1).
Net revenues were $431.5 million for the fourth quarter of 2018, an increase of 7.8%, or $31.2 million, from $400.3 million for the same period of 2017. The increase in net revenues was primarily due to an increase in Las Vegas operations, partially offset by a decrease in Native American management fees due to the expiration of the Gun Lake management agreement in February of 2018.
Net income was $13.2 million for the fourth quarter of 2018, a decrease of 71.3%, or $32.8 million, from $46.0 million for the same period of 2017. The decrease in net income was primarily due to an after-tax decrease in the fair value of derivative instruments of $23.9 million. These results also reflect an out-of-period, one-time, non-cash adjustment related to a lease obligation regarding our corporate office building that increased interest expense by $9.3 million and decreased net income by $8.6 million.
Adjusted EBITDA was $135.1 million for the fourth quarter of 2018, an increase of 10.1%, or $12.4 million, from $122.7 million in the same period of 2017. The increase in Adjusted EBITDA was primarily due to an increase in Las Vegas operations, partially offset by a decrease in Native American management fees due to the Gun Lake expiration.
For the full year, net revenues were $1.68 billion in 2018, an increase of 2.4%, or $38.9 million, from $1.64 billion for the same period of 2017. The increase in net revenues was primarily due to a $69.6 million increase in Las Vegas operations, partially offset by a $31.0 million decrease in Native American operations due to the Gun Lake expiration.
For the full year, net income was $219.5 million in 2018, compared to $63.5 million for the same period of 2017. The increase in net income was primarily due to a gain associated with the extinguishment of tax receivable liabilities, as well as a prior year loss associated with the acquisition of the leases at Boulder Station and Texas Station.
For the full year, Adjusted EBITDA was $509.0 million in 2018, an increase of 2.4%, or $11.7 million, from $497.2 million in 2017, primarily due to a $23.7 million increase in Las Vegas operations, partially offset by a $15.1 million decrease in Native American operations due to the Gun Lake expiration.
Las Vegas Operations
Net revenues from Las Vegas operations were $409.5 million for the fourth quarter of 2018, an increase of 10.4%, or $38.5 million, from $371.0 million in the same period of 2017. Adjusted EBITDA from Las Vegas operations was $121.0 million for the fourth quarter of 2018, an increase of 14.4%, or $15.2 million, from $105.8 million in the same period of 2017.
Native American Management
Adjusted EBITDA from Native American operations was $19.1 million for the fourth quarter of 2018, a 22.1% decrease from $24.5 million in the same period of 2017. The decrease was primarily due to the Gun Lake expiration, partially offset by increased management fees generated under the Graton Resort management agreement.
Palace Station and Palms Redevelopment Update
The Palace Station redevelopment project was completed on schedule and on budget with all aspects of the project open as of the end of 2018. As of December 31, 2018, the Company has incurred $188 million in costs against the budget of $191 million.
The Palms redevelopment project remains on schedule and the budget remains unchanged with the remaining components of phase two expected to be complete in the second quarter of 2019 and phase three expected to be complete in the third quarter of 2019. As of December 31, 2018, the Company has incurred approximately $430 million in costs against the $690 million project.
Balance Sheet Highlights
The Company’s cash and cash equivalents at December 31, 2018 were $114.6 million and total principal amount of debt outstanding at the end of the fourth quarter was $2.91 billion. The Company’s debt to Adjusted EBITDA and interest coverage ratios were 5.0x and 4.4x, respectively.
Quarterly Dividend
The Company’s Board of Directors has declared a cash dividend of $0.10 per Class A common share for the first quarter of 2019. The dividend will be payable on March 29, 2019 to all stockholders of record as of the close of business on March 14, 2019.
Prior to the payment of such dividend, Station Holdco LLC (“Station Holdco”) will make a cash distribution to all unit holders of record, including the Company, of $0.10 per unit for a total distribution of approximately $11.7 million, approximately $7.0 million of which is expected to be distributed to the Company and approximately $4.7 million of which is expected to be distributed to the other unit holders of record of Station Holdco.
Conference Call Information
The Company will host a conference call today at 4:30 p.m. Eastern Time to discuss its financial results. The conference call will consist of prepared remarks from the Company and include a question and answer session. Those interested in participating in the call should dial (888) 317-6003, or (412) 317-6061 for international callers, approximately 15 minutes before the call start time. Please use the passcode: 4563756. A replay of the call will be available from today through February 20, 2019 at www.redrockresorts.com.
Presentation of Financial Information
(1) Adjusted EBITDA is a non-GAAP measure that is presented solely as a supplemental disclosure. We believe that Adjusted EBITDA is a widely used measure of operating performance in our industry and is a principal basis for valuation of gaming companies. We believe that in addition to net income, Adjusted EBITDA is a useful financial performance measurement for assessing our operating performance because it provides information about the performance of our ongoing core operations excluding non-cash expenses, financing costs, and other non-operational or non-recurring items. Adjusted EBITDA includes net income plus depreciation and amortization, share-based compensation, write-downs and other charges, net, tax receivable agreement liability adjustment, related party lease termination, asset impairment, interest expense, net, loss on extinguishment/modification of debt, net, change in fair value of derivative instruments, provision for income tax and other, and excludes Adjusted EBITDA attributable to the noncontrolling interests of MPM.
Company Information and Forward Looking Statements
Red Rock Resorts owns a majority indirect equity interest in and manages Station Casinos LLC (“Station Casinos”). Station Casinos is the leading provider of gaming and entertainment to the residents of Las Vegas, Nevada. Station Casinos’ properties, which are located throughout the Las Vegas valley, are regional entertainment destinations and include various amenities, including numerous restaurants, entertainment venues, movie theaters, bowling and convention/banquet space, as well as traditional casino gaming offerings such as video poker, slot machines, table games, bingo and race and sports wagering. Station Casinos owns and operates Red Rock Casino Resort Spa, Green Valley Ranch Resort Spa Casino, Palms Casino Resort, Palace Station Hotel & Casino, Boulder Station Hotel & Casino, Sunset Station Hotel & Casino, Santa Fe Station Hotel & Casino, Texas Station Gambling Hall & Hotel, Fiesta Rancho Casino Hotel, Fiesta Henderson Casino Hotel, Wildfire Rancho, Wildfire Boulder, Wild Wild West Gambling Hall & Hotel, Wildfire Sunset, Wildfire Valley View, Wildfire Anthem and Wildfire Lake Mead. Station Casinos also owns a 50% interest in Barley’s Casino & Brewing Company, Wildfire Casino & Lanes and The Greens. In addition, Station Casinos is the manager of Graton Resort & Casino in northern California.
This press release contains certain forward-looking statements with respect to the Company and its subsidiaries which involve risks and uncertainties that cannot be predicted or quantified, and consequently, actual results may differ materially from those expressed or implied herein. Such risks and uncertainties include, but are not limited to the effects of the economy and business conditions on consumer spending and our business; competition, including the risk that new gaming licenses or gaming activities are approved; our substantial outstanding indebtedness and the effect of our significant debt service requirements; our ability to refinance our outstanding indebtedness and obtain necessary capital; the impact of extensive regulation; risks associated with changes to applicable gaming and tax laws; risks associated with development, construction and management of new projects or the redevelopment or expansion of existing facilities; and other risks described in the filings of the Company with the Securities and Exchange Commission. In providing forward-looking statements, the Company is not undertaking any duty or obligation to update these statements publicly as a result of new information, future events or otherwise, except as required by law. If the Company updates one or more forward-looking statements, no inference should be drawn that it will make additional updates with respect to those other forward-looking statements.
|
Red Rock Resorts, Inc. |
|||||||
|
Consolidated Statements of Income |
|||||||
|
(amounts in thousands, except per share data) |
|||||||
|
(unaudited) |
|||||||
|
Three Months Ended |
Year Ended |
||||||
|
2018 |
2017 |
2018 |
2017 |
||||
|
Operating revenues: |
|||||||
|
Casino |
$ 240,757 |
$ 221,763 |
$ 940,483 |
$ 886,206 |
|||
|
Food and beverage |
100,971 |
87,995 |
381,197 |
365,448 |
|||
|
Room |
42,169 |
39,640 |
170,824 |
179,041 |
|||
|
Other |
27,054 |
22,940 |
100,912 |
92,967 |
|||
|
Management fees |
20,520 |
27,972 |
87,614 |
118,477 |
|||
|
Net revenues |
431,471 |
400,310 |
1,681,030 |
1,642,139 |
|||
|
Operating costs and expenses: |
|||||||
|
Casino |
84,854 |
79,388 |
326,980 |
311,086 |
|||
|
Food and beverage |
87,892 |
78,406 |
340,212 |
326,069 |
|||
|
Room |
19,314 |
19,297 |
78,440 |
81,768 |
|||
|
Other |
14,320 |
10,074 |
48,431 |
40,332 |
|||
|
Selling, general and administrative |
92,952 |
92,215 |
390,492 |
380,930 |
|||
|
Depreciation and amortization |
46,864 |
43,496 |
180,255 |
178,217 |
|||
|
Write-downs and other charges, net |
13,580 |
3,653 |
34,650 |
29,584 |
|||
|
Tax receivable agreement liability adjustment |
(263) |
(139,070) |
(90,638) |
(139,300) |
|||
|
Related party lease termination |
— |
— |
— |
100,343 |
|||
|
Asset impairment |
— |
— |
— |
1,829 |
|||
|
359,513 |
187,459 |
1,308,822 |
1,310,858 |
||||
|
Operating income |
71,958 |
212,851 |
372,208 |
331,281 |
|||
|
Earnings from joint ventures |
579 |
390 |
2,185 |
1,632 |
|||
|
Operating income and earnings from joint ventures |
72,537 |
213,241 |
374,393 |
332,913 |
|||
|
Other (expense) income: |
|||||||
|
Interest expense, net |
(46,800) |
(31,315) |
(143,099) |
(131,442) |
|||
|
Loss on extinguishment/modification of debt, net |
— |
(13,355) |
— |
(16,907) |
|||
|
Change in fair value of derivative instruments |
(14,938) |
11,053 |
12,415 |
14,112 |
|||
|
Other |
(67) |
(99) |
(354) |
(357) |
|||
|
(61,805) |
(33,716) |
(131,038) |
(134,594) |
||||
|
Income before income tax |
10,732 |
179,525 |
243,355 |
198,319 |
|||
|
Benefit (provision) for income tax |
2,449 |
(133,556) |
(23,875) |
(134,786) |
|||
|
Net income |
13,181 |
45,969 |
219,480 |
63,533 |
|||
|
Less: net income attributable to noncontrolling interests |
4,235 |
16,497 |
61,939 |
28,110 |
|||
|
Net income attributable to Red Rock Resorts, Inc. |
$ 8,946 |
$ 29,472 |
$ 157,541 |
$ 35,423 |
|||
|
Earnings per common share: |
|||||||
|
Earnings per share of Class A common stock, basic |
$ 0.13 |
$ 0.43 |
$ 2.28 |
$ 0.53 |
|||
|
Earnings per share of Class A common stock, diluted |
$ 0.11 |
$ 0.35 |
$ 1.77 |
$ 0.42 |
|||
|
Weighted-average common shares outstanding: |
|||||||
|
Basic |
69,283 |
68,486 |
69,115 |
67,397 |
|||
|
Diluted |
116,414 |
116,274 |
116,859 |
115,930 |
|||
|
Dividends declared per common share |
$ 0.10 |
$ 0.10 |
$ 0.40 |
$ 0.40 |
|||
|
Red Rock Resorts, Inc. |
|||||||
|
Segment Information and Reconciliation of Net Income to Adjusted EBITDA |
|||||||
|
(amounts in thousands) |
|||||||
|
(unaudited) |
|||||||
|
Three Months Ended |
Year Ended |
||||||
|
2018 |
2017 |
2018 |
2017 |
||||
|
Net revenues |
|||||||
|
Las Vegas operations |
$ 409,483 |
$ 370,985 |
$ 1,588,003 |
$ 1,518,442 |
|||
|
Native American management |
20,365 |
27,842 |
87,009 |
117,968 |
|||
|
Reportable segment net revenues |
429,848 |
398,827 |
1,675,012 |
1,636,410 |
|||
|
Corporate and other |
1,623 |
1,483 |
6,018 |
5,729 |
|||
|
Net revenues |
$ 431,471 |
$ 400,310 |
$ 1,681,030 |
$ 1,642,139 |
|||
|
Net income |
$ 13,181 |
$ 45,969 |
$ 219,480 |
$ 63,533 |
|||
|
Adjustments |
|||||||
|
Depreciation and amortization |
46,864 |
43,496 |
180,255 |
178,217 |
|||
|
Share-based compensation |
2,417 |
2,195 |
11,289 |
7,922 |
|||
|
Write-downs and other charges, net |
13,580 |
3,653 |
34,650 |
29,584 |
|||
|
Tax receivable agreement liability adjustment |
(263) |
(139,070) |
(90,638) |
(139,300) |
|||
|
Related party lease termination |
— |
— |
— |
100,343 |
|||
|
Asset impairment |
— |
— |
— |
1,829 |
|||
|
Interest expense, net |
46,800 |
31,315 |
143,099 |
131,442 |
|||
|
Loss on extinguishment/modification of debt, net |
— |
13,355 |
— |
16,907 |
|||
|
Change in fair value of derivative instruments |
14,938 |
(11,053) |
(12,415) |
(14,112) |
|||
|
Adjusted EBITDA attributable to MPM noncontrolling interest |
— |
(1,780) |
(962) |
(15,262) |
|||
|
(Benefit) provision for income tax |
(2,449) |
133,556 |
23,875 |
134,786 |
|||
|
Other |
67 |
1,099 |
329 |
1,357 |
|||
|
Adjusted EBITDA |
$ 135,135 |
$ 122,735 |
$ 508,962 |
$ 497,246 |
|||
|
Adjusted EBITDA |
|||||||
|
Las Vegas operations |
$ 120,971 |
$ 105,790 |
$ 457,379 |
$ 433,640 |
|||
|
Native American management |
19,124 |
24,548 |
80,795 |
95,897 |
|||
|
Reportable segment Adjusted EBITDA |
140,095 |
130,338 |
538,174 |
529,537 |
|||
|
Corporate and other |
(4,960) |
(7,603) |
(29,212) |
(32,291) |
|||
|
Adjusted EBITDA |
$ 135,135 |
$ 122,735 |
$ 508,962 |
$ 497,246 |
|||
Source: Red Rock Resorts, Inc.
Gambling in the USA
Games Global Launches Custom Slot Game Caesars Palace Frenzy with Caesars Digital

Launch marks the first bespoke game launch in the partnership between gaming operator and premier gaming provider
Games Global today announced the exclusive launch of Caesars Palace Frenzy, a Caesars-branded slot title that marks the first bespoke game launch on behalf of Games Global’s partnership with premier gaming operator Caesars Digital. Caesars Palace Frenzy is now exclusively live on Caesars Palace Online Casino in New Jersey with plans to expand to Michigan and Pennsylvania, offering players another highly engaging, operator-specific gaming experience with iconic Caesars Palace branding.
Caesars Palace Frenzy combines the excitement of the Las Vegas Strip’s iconic casino with innovative gaming dynamics crafted by Games Global. Designed exclusively for Caesars Digital online casino players, this game delivers an online slot experience with engaging gameplay, sophisticated graphics and dynamic features like scatter pays, multiplied free spins selected by a concentric wheel and a seven-tier jackpot line-up.
This launch demonstrates Games Global’s continued emphasis on partnering with top iGaming operators to deliver exclusive and custom gaming products to players.
“Working closely with Caesars Digital to create Caesars Palace Frenzy has been an exciting journey,” the Chief Executive Officer for Games Global, Walter Bugno, said. “This game is more than just an online slot experience, it is an adventure that mirrors the thrill and grandeur of one of the world’s most iconic destinations. We’re thrilled to see it come to life and deliver a unique blend of entertainment and gaming.”
“We’re committed to collaborating with top gaming providers to launch custom online casino experiences for our players that can’t be found anywhere else,” the Senior Vice-President and Chief iGaming Officer for Caesars Digital, Matt Sunderland, said. “Caesars Palace Frenzy delivers on that commitment by providing an elevated gaming experience that we’re certain our players will enjoy.”
Gambling in the USA
Alabama-Coushatta Tribe of Texas Announces Plans to Build New Casino Resort

The Alabama-Coushatta Tribe of Texas has announced the plans to build a brand-new casino resort on its Tribal lands in Polk County.
“We are incredibly excited to embark on this new chapter. This new casino resort will not only provide significant economic benefits for those living and working in the region, but it will also become a vibrant destination for visitors,” Ricky Sylestine, Chairman of the Tribal Council, said.
While specific details are still being finalized, the new resort may offer a variety of amenities including a state-of-the-art casino floor, hotel accommodations, and diverse dining and entertainment options.
The Tribe has engaged the architectural firm FFKR to design the new resort. FFKR is known for its innovative and creative designs. The Tribe is confident the firm will create a truly exceptional destination.
In addition to the new casino resort, the Tribe is planning an extensive remodel to its existing Ischoopa/One Stop Convenience Store and Truck Stop. The remodel will include adding electronic bingo machines.
The Alabama-Coushatta Tribe of Texas will be releasing news related to the new resort and any additional developments in the coming months.
Gambling in the USA
BetConstruct to Display Its Products and Services at Sigma Americas

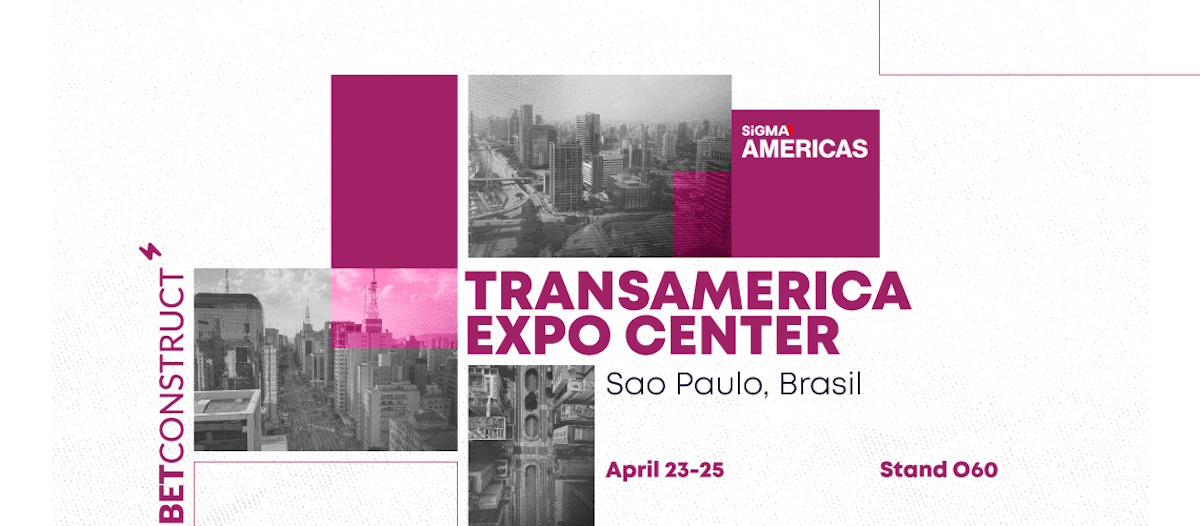
BetConstruct, a leading company in iGaming technology and services, is heading to Sigma Americas in Sao Paulo, Brazil from April 23-25, 2024.
Sigma Americas is a major event focusing on iGaming with 10,000 delegations and more than 200 professional speakers. This event serves as an exceptional platform for participants to present their innovative offerings, engage with fellow industry leaders, and establish new business relationships.
BetConstruct is poised to introduce its cutting-edge products and solutions to the growing Brazilian market at the upcoming event. As a premier provider of online iGaming solutions, the company will showcase its comprehensive range of services to all attendees, offering diverse solutions tailored to meet their specific needs and preferences.
Moreover, BetConstruct will demonstrate its newest Spettacolare offer by Mr. First, which is a fleeting opportunity to maximise user profits and explore the potential of FTN.
Attendees of the event can find BetConstruct in the Transamerica Expo Center at Stand O60, where they will have the opportunity to gain a comprehensive understanding of BetConstruct’s products and solutions.
-

 Latest News3 days ago
Xpoint Launches Groundbreaking New Capability to Reduce Geolocation Costs for Operators
-

 Latest News4 days ago
FBMDS, Planet Invest and EverPlay Score a Fantastic Goal in a Revolutionary Partnership Involving Ronaldinho Gaucho
-

 Press Releases2 days ago
YouGov unveils US bettor research report, which highlights that 43% of sports bettors use three or more sportsbook apps
-

 Compliance Updates4 days ago
Hub88 granted supplier licence in Peru
-

 Gambling in the USA4 days ago
Games Global Launches Custom Slot Game Caesars Palace Frenzy with Caesars Digital
-

 Latest News2 days ago
SCCG Announces Strategic Partnership with Comm100 to Enhance Player Engagement with Leading Customer Support Solutions
-

 Latest News4 days ago
Xtremepush boosts Brazilian presence with Weebet platform deal
-

 Compliance Updates2 days ago
U.S. INTEGRITY AND ODDS ON COMPLIANCE ANNOUNCE REBRAND AS INTEGRITY COMPLIANCE 360


