Press Releases
PlayIndiana.com: March Madness propels Indiana sportsbooks to second-best month ever

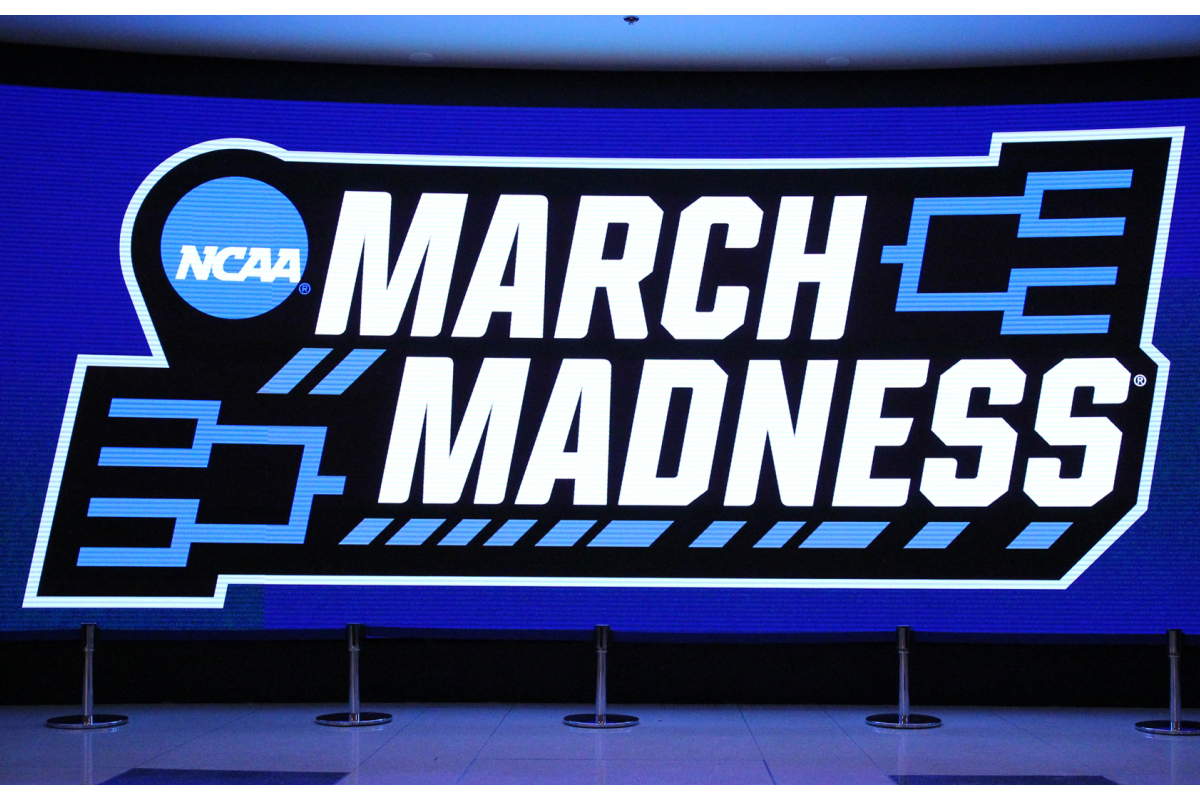
Indiana’s sportsbooks reversed their February dip, using a completely home-grown NCAA Tournament to push monthly betting volume past the $300 million mark, according to PlayIndiana, which provides news and analysis of the state’s gaming industry.
“We expect to see high volume across most legal U.S. markets in March, but Indiana’s circumstances were unique with March Madness played entirely in Indiana,” said Jessica Welman, lead analyst at PlayIndiana. “It’s hard to know just how much it moved the needle, but March’s results were clearly fueled by a huge volume of NCAA Tournament games all in one place and by a number of fans who traveled to Indiana and then bet legally as they attended games. We may never see a betting event quite like that ever again.”
Indiana sportsbooks brought in $316.7 million in wagers in March, according to official reporting released Monday. That is the second-most for a month in Indiana and up 15.6% from $273.9 million in February. Only January’s record of $348.2 million topped March’s results, pushing Indiana’s lifetime handle to $3.1 billion since launch.
Sportsbooks generated $26.4 million in revenue, a 55.4% increase from $17 million in February, and only topped by the record $29.3 million set in January. March’s revenue yielded $2.5 million in state taxes.
Year-over-year, March’s handle was up 323.3% from $74.8 million in March 2020, a month marred by the pandemic-related shutdown of major U.S. sports, including the NCAA Tournament. Revenue rose 379.5% year-over-year from $5.5 million in March 2020.
“What a difference a year makes, even if comparing this year to last year is apples and oranges,” said Nicole Russo, analyst for PlayIndiana. “Beyond the shutdowns, so much has changed in Indiana’s landscape. Yet, the state continues to fare well in large part because its regulatory framework has been fair and unlike its neighbors in Illinois, consistent. That has created a resilient state industry able to withstand increased competition from neighboring states and a brutal pandemic.”
Online betting accounted for 88.1%, or $279.2 million, of the state’s handle, a modest decrease from 88.4% in February. $160.6 million of March’s bets were on basketball, a dramatic increase from $127.2 million in February as March Madness gripped the attention of bettors. That came even as Purdue, the lone Indiana representative in the NCAA Tournament among the state’s 10 Division I men’s programs, was knocked out in the first round.
“For a basketball-crazy state like Indiana, a dearth of local teams could have really lowered the state’s handle,” Welman said. “But it appears that the proximity of the tournament made up for a lack of Indiana representation.”
DraftKings/Ameristar Casino led the state’s operators with $111.2 million in online bets, up from $107.4 million in February and accounting for 39.8% of the state’s online handle. The month produced $8.5 million in receipts, up from $3.7 million in January. FanDuel/Blue Chip Casino was second with $92.4 million in bets, up from $70.9 million in February. That produced $6.8 million in receipts, up from $5 million.
The leaders were followed by:
- BetMGM/Belterra ($39.4 million handle, up from $33 million in January; $3.6 million win, up from $2.2 million).
- PointsBet/Hollywood Lawrenceburg ($13.1 million handle, up from $11.3 million; $1.7 million win, up from $1.3 million)
- William Hill/Tropicana Evansville ($9.5 million handle, up from $5.6 million; $879,577 win, up from $584,406)
- BetRivers/French Lick Resort ($9.2 million handle, up from $7.5 million; $829,034 win, up from $490,139)
- TheScore/Ameristar ($3 million handle, up from $2.7 million; $263,111 win, up from $180,674)
- Unibet/Horseshoe Hammond ($2.1 million handle, up from $1.8 million; $139,283 win, up from $70,125)
- Caesars/Horseshoe Hammond ($229,488 handle, down from $667,360; $1,392 win, up from -$20,062)
- BetAmerica/Rising Star Casino ($76,686 handle, down from $100,555; $1,191 win, down from $3,328)
$37.5 million in bets were placed at retail sportsbooks In March, up from $32.9 million in February. Hollywood Lawrenceburg, nearest Cincinnati, led the retail market with $10.8 million in wagers. Ameristar East Chicago was second with $6.2 million.
Operators in Indiana may also receive a boost from Illinois, where Gov. J.B. Pritzker reinstated in-person registration for that state’s online sportsbooks. That decision could make traveling across the border from the Chicago area more appealing, at least for some.
“Indiana has always been a market that has capitalized on large markets just across its borders,” Russo said. “Illinois’ decision could modestly move the needle, especially for the Chicago-area casinos that have always counted on out-of-state bettors as a significant portion of their customer base.”
For more revenue information on Indiana sportsbooks, visit PlayIndiana.com/revenue.
Latest News
Kambi Group plc signs Turnkey Sportsbook partnership with Latin American operator RedCap

New agreement will see Kambi initially power the operator’s online Betpro and Starplay brands in El Salvador and Panama, with plans for retail and additional markets in the future
Kambi Group plc, the home of premium sports betting solutions, has agreed a long-term, omni-channel sportsbook partnership with Latin American operator RedCap, further strengthening Kambi’s position as the sportsbook provider of choice in the region.
Under the terms of the agreement, RedCap’s Betpro and Starplay brands will integrate Kambi’s high-performance Turnkey Sportsbook into its proprietary player account management (PAM) platform, enabling a seamless sports betting experience. The operator will replace its current supplier with Kambi’s powerful end-to-end sports betting solution, trusted by market leaders across Latin America and beyond.
The initial rollout will see Betpro and Starplay launch Kambi’s technology across its online sportsbooks in El Salvador and Panama, with the agreement also including scope for retail provision and market expansion. Operating under a multi-brand strategy led by its flagship Betpro brand, the operator aims to leverage the strengths of Kambi’s sportsbook with its in-house technical capability and experienced industry leadership team to achieve success in each market.
Werner Becher, CEO of Kambi, said: “This partnership marks an important next step in Kambi’s Latin American growth strategy. By selecting Kambi to replace their existing provider, RedCap has shown clear confidence in our market-leading technology and ability to support scalable growth. We are excited to help them bring best-in-class sports betting experiences to players across the region.”
Oscar Henao, CEO of RedCap, added: “We are thrilled to join forces with Kambi. This agreement gives us the product and flexibility we need to compete at the highest level, offering our customers premium betting experience across all channels. With Kambi’s support, we look forward to launching in Panama and El Salvador and expanding into new markets as we execute our multi-brand strategy.”
Financial reports
PGCB Reports Record Revenue of Nearly $6.4 Billion from Legal Gambling in State Fiscal Year

The Pennsylvania Gaming Control Board (“PGCB”) today reported that revenue generated during the combined Fiscal Year 2024/2025 of gaming it regulates reached a record level of $6,394,641,819.
This figure consists of the combined revenue from casino slot machines and table games, iGaming, sports wagering, video gaming terminals (VGTs) and fantasy sports contests. The amount eclipses the previous high for revenue in a fiscal year of $5,892,516,807 achieved in 2023/2024. Pennsylvania’s Fiscal Year runs from July 1 to June 30.
The resulting tax revenue from the play of these games in Fiscal Year 2024/2025 was $2,797,395,982. That figure eclipses the previous high for tax revenue in a fiscal year achieved during 2023/2024 of approximately $2.54 billion. The estimated amounts for revenue and taxes being reported are prior to any possible adjustments by the PA Department of Revenue.
Tax revenue from the various forms of gaming regulated by the PGCB is returned to Pennsylvanians in a number of ways. These include, but are not limited to:
- school property tax reduction on an owner’s primary residence;
- state, county, and local economic development, safety and recreational projects;
- support of the agricultural industry through support of horse racing; and,
- revenue toward the Commonwealth’s General Fund.
A comparison of combined revenue is below:
Fiscal Year |
Slot Machine Revenue |
iGaming Revenue |
Table Games Revenue |
Sports Wagering Revenue |
VGT’s Revenue |
Fantasy Sports Contests |
Total Gaming Revenue |
12/13 |
$2,428,887,430 |
|
$713,107,163 |
|
|
|
$3,141,994,593 |
13/14 |
$2,319,890,598 |
|
$731,874,861 |
|
|
|
$3,051,765,460 |
14/15 |
$2,335,787,919 |
|
$779,738,065 |
|
|
|
$3,115,525,984 |
15/16 |
$2,388,658,549 |
|
$839,177,086 |
|
|
|
$3,227,835,635 |
16/17 |
$2,336,152,508 |
|
$866,518,820 |
|
|
|
$3,202,671,328 |
17/18 |
$2,352,320,937 |
|
$895,278,806 |
|
|
$2,349,569 |
$3,249,949,311 |
18/19 |
$2,378,859,341 |
|
$885,588,231 |
$21,730,113 |
|
$23,588,490 |
$3,309,766,175 |
19/20 |
$1,697,955,473 |
$240,894,852 |
$644,543,736 |
$113,724,759 |
$6,798,123 |
$20,868,176 |
$2,724,785,117 |
20/21 |
$1,887,573,437 |
$897,216,020 |
$721,763,471 |
$308,849,184 |
$31,334,744 |
$28,186,529 |
$3,874,923,386 |
21/22 |
$2,410,313,212 |
$1,232,309,138 |
$1,015,735,661 |
$315,716,247 |
$41,584,158 |
$27,308,976 |
$5,042,967,392 |
22/23 |
$2,452,239,440 |
$1,532,761,065 |
$974,018,112 |
$491,960,612 |
$42,114,593 |
$20,668,195 |
$5,513,762,017 |
23/24 |
$2,438,537,357 |
$1,949,017,248 |
$958,027,818 |
$486,566,429 |
$41,105,387 |
$19,262,568 |
$5,892,516,807 |
24/25 |
$2,440,474,767 |
$2,477,083,825 |
$928,915,940 |
$487,639,844 |
$41,392,843 |
$19,134,601 |
$6,394,641,819 |
Retail Slot Machine Revenue
Fiscal Year 2024/25 gross revenue from slot machines at the casinos was $2,440,474,767, a 0.08% increase in revenue when compared to the $2,438,537,357 generated in Fiscal Year 2023/24.
Slot machine revenue for each of the casinos, with the percentage change reflected over the previous year, is as follows:
Retail Slot Machine Revenue by Operator |
Slot Machine Revenue FY2024/25 |
Slot Machine Revenue FY2023/24 |
% Change |
Parx Casino |
$377,741,868 |
$377,032,792 |
0.19% |
Wind Creek Bethlehem |
$281,813,834 |
$284,307,219 |
-0.88% |
Rivers Casino Pittsburgh |
$259,376,552 |
$265,520,300 |
-2.31% |
Mohegan Pennsylvania |
$175,512,043 |
$178,826,406 |
-1.85% |
Hollywood Casino at the Meadows |
$165,364,220 |
$162,709,117 |
1.63% |
Mount Airy Casino Resort |
$153,287,514 |
$155,143,779 |
-1.20% |
Live! Casino Philadelphia |
$152,124,613 |
$144,926,580 |
4.97% |
Rivers Casino Philadelphia |
$137,486,000 |
$133,819,461 |
2.74% |
Hollywood Casino at Penn National Race Course |
$134,995,246 |
$137,320,744 |
-1.69% |
Harrah’s Philadelphia |
$105,042,096 |
$109,918,495 |
-4.44% |
Valley Forge Casino Resort |
$103,226,169 |
$103,889,859 |
-0.64% |
Live! Casino Pittsburgh |
$99,739,181 |
$99,808,958 |
-0.07% |
Presque Isle Downs and Casino |
$85,948,165 |
$89,925,305 |
-4.42% |
Hollywood Casino York |
$85,268,464 |
$80,121,662 |
6.42% |
Hollywood Casino Morgantown |
$61,408,784 |
$59,013,269 |
4.06% |
Parx Shippensburg |
$36,866,401 |
$34,471,430 |
6.95% |
The Casino at Nemacolin |
$25,273,617 |
$21,781,982 |
16.03% |
Statewide Total |
$2,440,474,767 |
$2,438,537,357 |
0.08% |
Tax revenue from the play of slots machines in Fiscal Year 2024/25, including mandated fees paid by some operators, amounted to $1,343,013,822.
Retail Table Games Revenue
Fiscal Year 2024/25 gross revenue from table games at the casinos was $928,915,940, a 3.04% decrease in revenue when compared to the $958,027,818 generated in Fiscal Year 2023/24.
Table games revenue for each of the casinos, with the percentage change reflected over the previous year, is as follows:
Retail Table Games Revenue by Operator |
Table Games Revenue FY2024/25 |
Table Games Revenue FY2023/24 |
% Change |
Wind Creek Bethlehem |
$248,027,460 |
$252,200,606 |
-1.65% |
Parx Casino |
$196,413,495 |
$199,049,817 |
-1.32% |
Live! Casino Philadelphia |
$104,163,224 |
$107,817,308 |
-3.39% |
Rivers Casino Philadelphia |
$82,091,166 |
$86,998,189 |
-5.64% |
Rivers Casino Pittsburgh |
$73,919,682 |
$79,129,580 |
-6.58% |
Valley Forge Casino Resort |
$37,167,593 |
$33,693,962 |
10.31% |
Mount Airy Casino Resort |
$35,514,513 |
$34,636,221 |
2.54% |
Mohegan Pennsylvania |
$28,386,495 |
$27,999,899 |
1.38% |
Hollywood Casino at Penn National Race Course |
$24,867,554 |
$24,576,944 |
1.18% |
Harrah’s Philadelphia Casino |
$22,172,289 |
$26,708,238 |
-16.98% |
Hollywood Casino at the Meadows |
$21,931,051 |
$28,181,270 |
-22.18% |
Live! Casino Pittsburgh |
$14,750,775 |
$15,535,302 |
-5.05% |
Hollywood Casino York |
$13,612,400 |
$15,918,424 |
-14.49% |
Presque Isle Downs and Casino |
$12,364,452 |
$13,038,895 |
-5.17% |
Hollywood Casino Morgantown |
$10,207,462 |
$9,272,263 |
10.09% |
The Casino at Nemacolin |
$2,552,301 |
$2,377,478 |
7.35% |
Parx Shippensburg |
$774,029 |
$893,423 |
-13.36% |
Statewide Total |
$928,915,940 |
$958,027,818 |
-3.04% |
Tax revenue from the play of table games in Fiscal Year 2024/25 was $154,879,545.
Internet Casino-Type Gaming (iGaming) Revenue
Fiscal Year 2024/25 revenue from iGaming was $2,477,083,825, a 27.09% increase in revenue when compared to the $1,949,017,248 generated in Fiscal Year 2023/24. This revenue amount is a high mark for a fiscal year.
Operator |
FY2024/25 |
FY2023/24 |
% Change |
Hollywood Casino at Penn National Race Course |
$935,823,045 |
$751,177,422 |
24.58% |
Valley Forge Casino Resort |
$675,170,190 |
$482,491,457 |
39.93% |
Rivers Casino Philadelphia |
$411,718,444 |
$356,647,653 |
15.44% |
Harrah’s Philadelphia |
$115,994,074 |
$102,020,334 |
13.70% |
Golden Nugget |
$79,696,001 |
$39,281,525 |
102.88% |
Parx Casino |
$58,964,411 |
$58,835,932 |
0.22% |
Live! Casino Philadelphia |
$54,177,983 |
$39,973,190 |
35.54% |
Mount Airy Casino Resort |
$42,559,169 |
$46,187,631 |
-7.86% |
Bally’s Pennsylvania |
$41,566,491 |
$32,518,516 |
27.82% |
Presque Isle Downs and Casino |
$23,128,408 |
n/a |
n/a |
Mohegan Pennsylvania |
$20,183,159 |
$17,081,366 |
18.16% |
Wind Creek Bethlehem |
$18,102,450 |
$22,802,222 |
-20.61% |
Statewide Total |
$2,477,083,825 |
$1,949,017,248 |
27.09% |
Tax revenue from iGaming in Fiscal Year 2024/25 was $1,099,557,803.
Sports Wagering Revenue
Fiscal Year 2024/25 revenue from sports wagering was $487,639,844, a 0.22% decrease in revenue when compared to the $486,566,429 generated in Fiscal Year 2023/24. At the same time, the sports wagering handle increased between the two fiscal years from $8,169,540,520 to $8,721,795,533.
Sports wagering revenue for each of the casinos, with the percentage change reflected over the previous year, is as follows:
Sports Wagering Revenue by Operator |
Sports Wagering Revenue FY2024/25 |
Sports Wagering Revenue FY2023/24 |
% Change |
Valley Forge Casino Resort |
$250,290,144 |
$249,370,325 |
0.37% |
Hollywood Casino at the Meadows |
$131,189,196 |
$137,139,171 |
-4.34% |
Hollywood Casino Morgantown |
$19,991,392 |
$21,196,614 |
-5.69% |
Hollywood Casino at Penn National Race Course |
$16,995,365 |
$4,701,217 |
261.51% |
Rivers Casino Pittsburgh |
$14,869,925 |
$16,901,149 |
-12.02% |
Parx Casino |
$12,466,404 |
$16,833,893 |
-25.94% |
Hollywood Casino York |
$10,753,708 |
$6,102,831 |
76.21% |
Harrah’s Philadelphia |
$9,983,926 |
$8,362,280 |
19.39% |
Rivers Casino Philadelphia |
$9,215,349 |
$8,289,394 |
11.17% |
Live! Casino Philadelphia |
$5,326,723 |
$6,331,196 |
-15.87% |
Presque Isle Downs and Casino |
$1,788,457 |
$1,043,731 |
71.35% |
Live! Casino Pittsburgh |
$1,518,356 |
$1,609,231 |
-5.65% |
Mohegan Sun Lehigh Valley |
$1,076,750 |
$1,397,927 |
-22.98% |
Mohegan Pennsylvania |
$973,182 |
$3,271,401 |
-70.25% |
Wind Creek Bethlehem |
$489,195 |
$1,072,775 |
-54.40% |
Mount Airy Casino Resort |
$357,192 |
$704,580 |
-49.30% |
South Philly Race & Sportsbook |
$250,878 |
$2,038,030 |
-87.69% |
Parx Shippensburg |
$103,704 |
$109,718 |
-5.48% |
Parx Malvern |
n/a |
$90,967 |
n/a |
Statewide Total |
$487,639,844 |
$486,566,429 |
0.22% |
Tax revenue from Sports Wagering in Fiscal Year 2024/25 was $175,550,344.
Video Gaming Terminals
Fiscal Year 2024/25 revenue for Video Gaming Terminals at Truck Stops was $41,392,843, a 0.70% increase when compared to the $41,105,387 in Fiscal Year 2023/24. At the end of this fiscal year, there were 75 VGT facilities operating in Pennsylvania compared to 74 facilities in operation at the end of Fiscal Year 2023/2024.
VGT revenue for each of the providers, with the percentage change reflected over the previous year, is as follows:
VGT Terminal Operator |
VGT Revenue FY2024/25 |
VGT Revenue FY2023/24 |
% Change |
Marquee by Penn1 |
$27,567,893 |
$25,876,995 |
6.53% |
J&J Ventures Gaming2 |
$10,410,895 |
$11,462,180 |
-9.17% |
Jango Entertainment3 |
$3,250,748 |
$3,419,612 |
-4.94% |
Venture Gaming LLC4 |
$109,734 |
$266,424 |
-58.81% |
Accel Entertainment Gaming5 |
$53,573 |
$80,177 |
-33.18% |
Statewide Total |
$41,392,843 |
$41,105,387 |
0.70% |
Tax revenue from VGTs in Fiscal Year 2024/25 was $21,524,278.
Fantasy Contests Revenue
Fiscal Year 2024/25 revenue from fantasy contests was $19,134,601, a 0.66% decrease in revenue when compared to the $19,262,568 generated in Fiscal Year 2023/24.
Fantasy contests revenue for each of the providers, with the percentage change reflected over the previous year, is as follows:
Fantasy Contests Operator |
Fantasy Revenue FY2024/25 |
Fantasy Revenue FY2023/24 |
% Change |
DraftKings |
$13,359,018 |
$13,585,594 |
-1.67% |
FanDuel |
$3,291,034 |
$3,685,166 |
-10.70% |
UnderDog Sports |
$1,900,354 |
$1,306,281 |
45.48% |
Fantasy Football Players Championship |
$255,652 |
$292,287 |
-12.53% |
Yahoo Fantasy Sports |
$152,853 |
$219,313 |
-30.30% |
Sportshub Technologies |
$72,239 |
$72,931 |
-0.95% |
Fantasy Sports Gaming, LLC |
$67,624 |
$69,398 |
-2.56% |
DataForce |
$38,216 |
$35,986 |
6.20% |
Jock MKT |
$0 |
-$131 |
-100.00% |
OwnersBox |
-$2,389 |
-$4,257 |
-43.88% |
Statewide Total |
$19,134,601 |
$19,262,568 |
-0.66% |
Tax revenue from Fantasy Contests in Fiscal Year 2024/25 was $2,870,190.
Latest News
THE 56th ANNUAL WORLD SERIES OF POKER® SETS NEW RECORDS

The 2025 WSOP sets unprecedented benchmarks across entries, prize money, and payouts, solidifying its status as the pinnacle of live tournament poker
After eight weeks of thrilling competition, the 56th annual World Series of Poker (WSOP®) at the Paris Las Vegas and Horseshoe Las Vegas officially concluded on July 16. The 2025 series has once again redefined live tournament poker, shattering multiple all-time records and further cementing its legendary status.
“The poker renaissance was on full display at the 2025 WSOP,” said Ty Stewart, Chief Executive Officer of WSOP. “If you missed the amazing action, the good news is that you can inevitably expect bigger and better next year. A sincere thank you to every player and staffer who came to Las Vegas and made this a summer to remember.”
The action-packed summer on the Las Vegas Strip featured appearances from a host of celebrities and poker legends, all vying for poker’s most coveted prize: the WSOP gold bracelet. In addition to the strong turnout, the 2025 WSOP will be remembered for the launch of the revolutionary WSOP+ app, which virtually eliminated registration lines throughout the summer and greatly enhanced the WSOP experience for the entire playing community.
2025 WSOP By the Numbers – A Historic Summer
This year’s WSOP delivered staggering figures, setting several new all-time records across the board:
-
246,960 entries – The most all-time entries for a single WSOP series
-
$481,761,879 – The largest total prize money awarded in WSOP history
-
37,311 places paid – The highest number of unique payouts in series history
-
43 – The number of $1M+ prizes won across the 2025 series
-
Event #53: Millionaire Maker No-Limit Hold’em attracted 11,996 entries, setting a new record for the largest $1,500 buy-in field in live tournament poker history
-
Event #89: Mid-Stakes Championship No-Limit Hold’em saw 3,797 entries, becoming the largest $3,000 buy-in field ever
-
Event #86: Mystery Bounty Pot-Limit Omaha drew 5,284 entries, establishing itself as the largest PLO field in live tournament poker history
-
57 events exceeded $2+ million prize pools – An all-time record for the series
-
9 events exceeded $10+ million prize pools – An all-time record for the series
Although this year’s summer tournament is over, the excitement continues with the WSOP Circuit (WSOP-C) 2025 Season Part 2 already underway, and the return of WSOP Paradise this winter in the Bahamas from Dec. 4 to 18. Additionally, WSOP Europe (WSOP-E) runs from Sept. 12 to Oct. 8, with the WSOP-E Main Event beginning on Oct. 3.
-
Latest News7 days ago
Caesars Entertainment and Bread Financial Introduce New Caesars Rewards® Prestige Visa, a Premium-Level Credit Card Allowing Caesars Rewards Members to Earn Tier Status Faster and Unlock Luxury Rewards with Every Purchase
-
Gambling in the USA6 days ago
Caesars Entertainment Bolsters Online Casino Live Dealer Offering with the Launch of Branded Live Dealer Studio in Michigan
-
Latest News6 days ago
Maryland Lottery and Gaming Comission Selects Intralot for Lottery System Contract
-
Canada5 days ago
AGCO takes action to remove unapproved gambling machines from Ontario convenience stores
-
Latest News6 days ago
Spinomenal Goes Live Across Caesars Entertainment’s Marquee Online Casino Brands in New Jersey
-
Latest News5 days ago
Brightstar Lottery Modernizes Retail and Digital Solutions for Missouri Lottery with OMNIA Deployment
-
Latest News5 days ago
Evolution Launches First Live Casino Studio in Brazil
-
Latest News5 days ago
Kambi appoints experienced LatAm executive Mateo Lenoble as Head of Sales in Latin America